LinkedIn Lead Gen Forms vs. Landing Pages: Compare Qualified Responses
A native form can halve the price of a submission while increasing the price of a qualified response. Compare both paths against the same offer.

A LinkedIn form produces twice as many submissions as a website landing page. The agency can legitimately celebrate the lower cost per submission. The client may still have paid more per useful inquiry.
LinkedIn’s Lead Gen Forms can prefill information, reducing the work someone has to do in the ad experience. A landing page can explain a complex offer, answer objections or collect context before sales calls. Compare the same buyer, offer, eligibility standard and follow-up promise. Results from a native checklist and a website request for a live consultation cannot isolate the effect of the form.
Apply one qualification check to both sets of submissions
Keep form source and the submitted answer intact. Where the collection terms permit employer research, use Match your data and Email enrich in RevenueBase Audience Builder on work emails from both sources. Inspect title and employer with the same criteria. Include unresolved records in each source’s figures; prefilled data from one form may make it easier to match.
For the API comparison, pass the submitted emails to POST /v2/contact/enrich and request title and employer using reveal: [] for both cohorts. Return the results to the original form IDs in your worksheet. A verified employer can help score fit, while the actual form response establishes what the person requested.
Follow the arithmetic beyond the submission
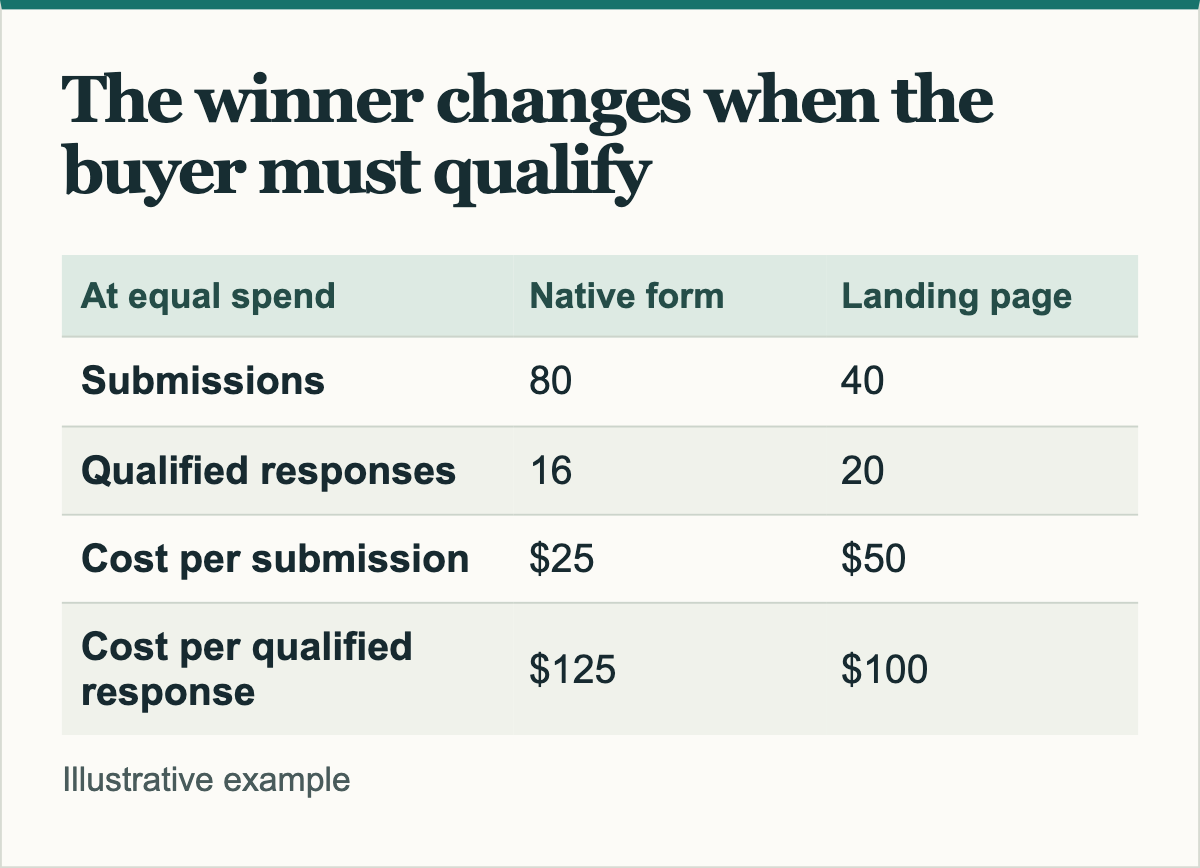
Suppose the agency spends $2,000 on each route. The native form produces 80 submissions; 16 qualify. The landing page produces 40 submissions; 20 qualify. The respective costs per submission are $25 and $50. Per qualified response, they are $125 and $100. Confirm the same reviewer applied the same standard, and be cautious about moving the whole budget on a difference of four qualified responses.
Where possible, assign comparable audiences to the two experiences. If the platforms or budget prevent that, document differences in timing, campaign mix and exposure. Inspect a sample of stale profile information, duplicate submissions and unexpected requests. Check whether leads actually reached the CRM with a useful company identifier and clear expectations for follow-up.
Keep a measure of form friction alongside cost per accepted opportunity. The former tells a designer where people drop out. The latter tells the client what it paid to generate plausible business. If the commercial results are close, the time required to repair profiles and route leads can break the tie more sensibly than the raw submission count.


See the data behind the argument.
Every claim we make is backed by data you can verify yourself.